Chapter 14: Performance Metrics and Evaluation
Quantitative and Qualitative Measurement Methods
Learning Objectives
After completing this chapter, you will be able to:
- Define quantitative metrics for prompt performance
- Apply qualitative evaluation methods
- Design evaluation benchmarks
- Implement continuous monitoring
- Balance multiple performance dimensions
The Measurement Imperative
Why Measure?
“What gets measured gets managed.” — Peter Drucker
Without measurement, prompt engineering remains subjective. With measurement, it becomes a science.
| Without Metrics | With Metrics |
|---|---|
| “It seems better” | “Accuracy improved 15%” |
| “I think this works” | “95% pass rate on tests” |
| “Users like it” | “4.2/5.0 satisfaction score” |
| “It’s faster somehow” | “Response time: 2.3s avg” |
What to Measure
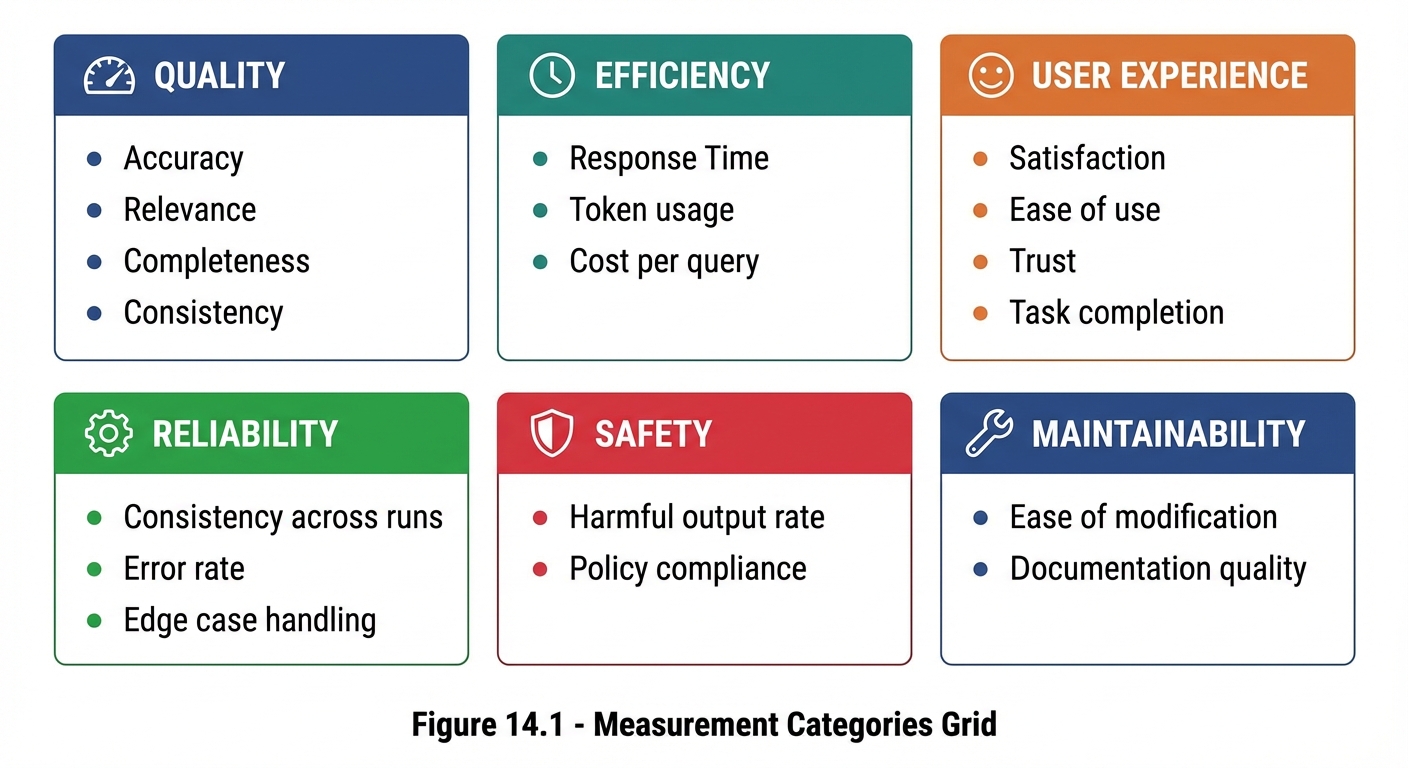 Figure 14.1: Six categories of prompt performance metrics spanning quality, efficiency, user experience, and operations.
Quantitative Metrics
Core Metrics
| Metric | Definition | Formula | Target |
|---|---|---|---|
| Accuracy | Correct responses / Total | Correct / Total × 100% | ≥95% |
| Task Completion | Successfully completed / Attempted | Complete / Attempted × 100% | ≥90% |
| Format Compliance | Correct format / Total | Compliant / Total × 100% | ≥98% |
| Consistency | Same output for same input | Match rate × 100% | ≥85% |
| Response Time | Average time to response | Sum(times) / Count | <3s |
Accuracy Metrics
## Accuracy Measurement

### Definition
Percentage of responses that are factually correct.

### Measurement Method
1. Create evaluation set with known-correct answers
2. Run prompts against evaluation set
3. Score responses as Correct/Incorrect/Partial
4. Calculate: (Correct + 0.5×Partial) / Total

### Example Calculation
- Total test cases: 100
- Correct: 80
- Partial: 10
- Incorrect: 10

Accuracy = (80 + 0.5×10) / 100 = 85%
Task Completion Rate
## Task Completion Measurement

### Definition
Percentage of tasks completed successfully without need for re-prompting.

### Measurement Method
1. Define "successful completion" criteria
2. Run tasks through prompt
3. Score as Complete/Incomplete
4. Calculate: Complete / Total

### Completion Criteria Examples
- For code: Runs without errors
- For writing: No placeholders, meets requirements
- For analysis: All parts addressed
Consistency Score
## Consistency Measurement

### Definition
How similar outputs are when the same input is provided multiple times.

### Measurement Method
1. Select test inputs
2. Run each input N times (e.g., 5)
3. Compare outputs for similarity
4. Score similarity (0-100%)
5. Average across all inputs

### Similarity Assessment
- Exact match: 100%
- Same meaning, different words: 80%
- Similar but notable differences: 60%
- Significantly different: 40%
- Contradictory: 0%
Qualitative Evaluation
Human Evaluation Methods
| Method | Description | Best For |
|---|---|---|
| Rating scales | Score on 1-5 or 1-10 scale | General quality |
| Comparison | Prefer A or B | A/B decisions |
| Rubric scoring | Detailed criteria checklist | Comprehensive assessment |
| Expert review | Domain specialist evaluation | High-stakes use cases |
Rating Scale Template
## Human Evaluation: Rating Scale

**Evaluator:** [Name]
**Prompt Version:** [Version]
**Date:** [Date]

For each response, rate on 1-5 scale:

### Response 1
- Relevance:     1  2  3  4  5
- Accuracy:      1  2  3  4  5
- Helpfulness:   1  2  3  4  5
- Clarity:       1  2  3  4  5
- Overall:       1  2  3  4  5

Notes: [Open comments]

### Summary Statistics
- Average Relevance: [X.X]
- Average Accuracy: [X.X]
- Average Helpfulness: [X.X]
- Average Clarity: [X.X]
- Overall Average: [X.X]
Comparison Evaluation
## Human Evaluation: Comparison

**Task:** [Description]
**Options:** Prompt A vs. Prompt B

For each test case, indicate preference:

### Test Case 1
Input: [Input]
- Response A: [A's response]
- Response B: [B's response]

Preference: □ Strongly A  □ Somewhat A  □ Equal  □ Somewhat B  □ Strongly B

### Summary
- Strong A: [count]
- Somewhat A: [count]
- Equal: [count]
- Somewhat B: [count]
- Strong B: [count]

**Winner:** [A/B/Tie]
Rubric-Based Evaluation
## Evaluation Rubric

### Criterion 1: Task Completion
□ (4) Fully complete, all requirements met
□ (3) Mostly complete, minor omissions
□ (2) Partially complete, significant gaps
□ (1) Barely addressed
□ (0) Not completed

### Criterion 2: Accuracy
□ (4) All information correct
□ (3) Minor inaccuracies
□ (2) Some errors
□ (1) Major errors
□ (0) Fundamentally wrong

### Criterion 3: Format
□ (4) Perfect format compliance
□ (3) Minor format issues
□ (2) Noticeable format problems
□ (1) Poor formatting
□ (0) Wrong format entirely

### Total Score: ___/12
Benchmark Development
What Is a Benchmark?
A benchmark is a standardized evaluation set used to measure and compare prompt performance consistently over time.
Benchmark Components
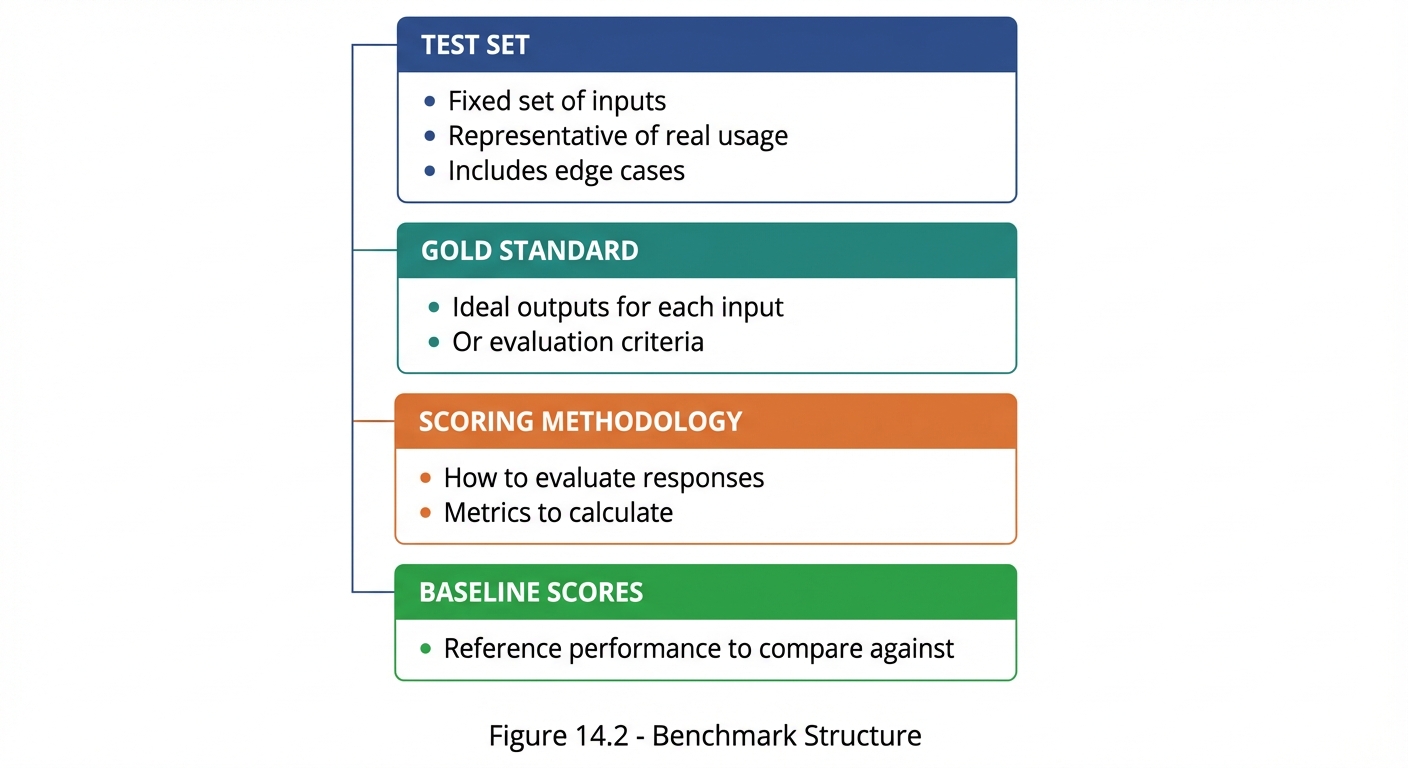 Figure 14.2: The four components of a complete evaluation benchmark for consistent prompt measurement.
Benchmark Design Template
## Benchmark: [Name]

### Purpose
Evaluate [prompt type] for [use case].

### Test Set (20 cases)

#### Typical Cases (12)
1. [Input 1] → Expected: [Output/Criteria]
2. [Input 2] → Expected: [Output/Criteria]
...

#### Edge Cases (5)
13. [Edge input 1] → Expected: [How to handle]
14. [Edge input 2] → Expected: [How to handle]
...

#### Error Cases (3)
18. [Error input 1] → Expected: [Error handling]
19. [Error input 2] → Expected: [Error handling]
20. [Error input 3] → Expected: [Error handling]

### Scoring Methodology
- Correct response: 1 point
- Partial response: 0.5 points
- Incorrect response: 0 points
- Maximum score: 20 points

### Baseline
- Current prompt v1.0: 15/20 (75%)
- Target: 18/20 (90%)
Continuous Monitoring
Monitoring Framework
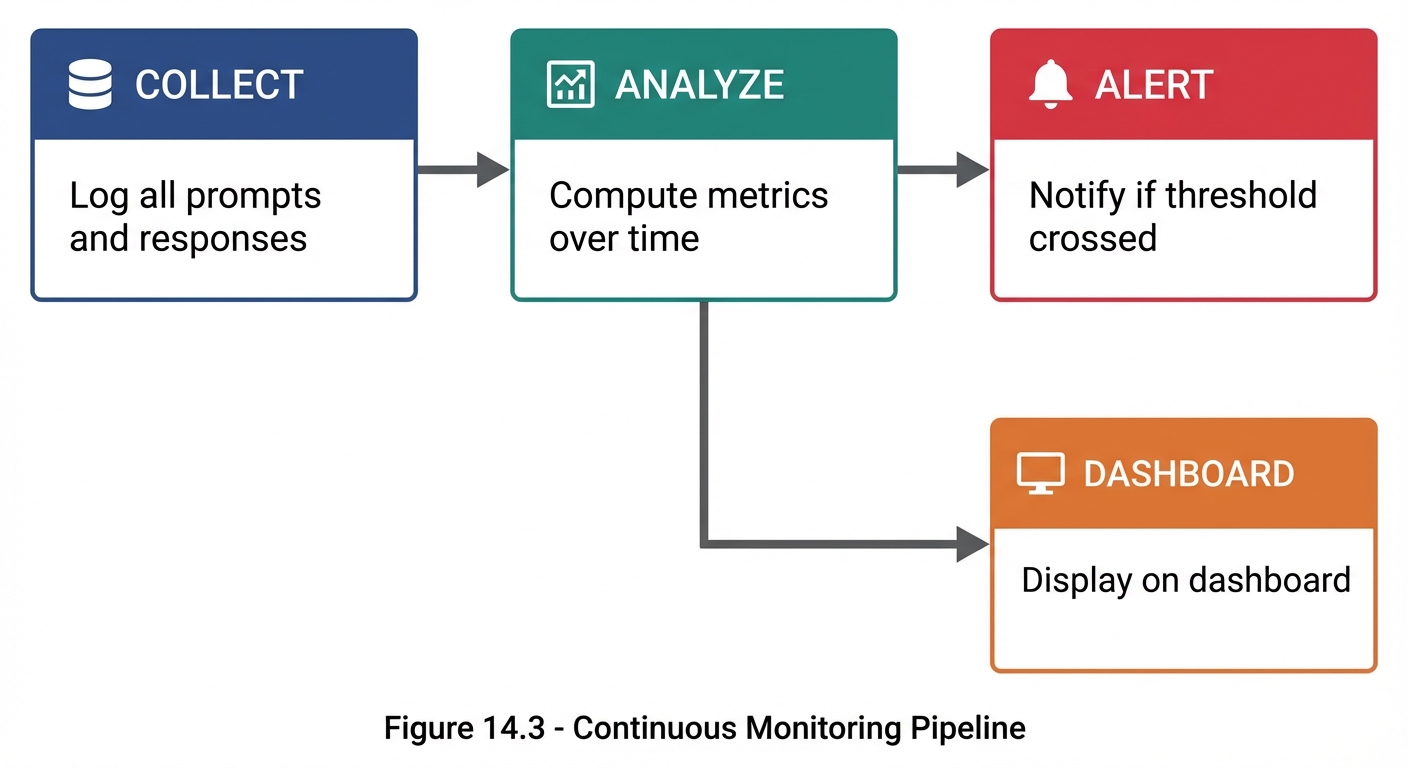 Figure 14.3: The continuous monitoring pipeline—collect data, analyze metrics, alert on issues, and display on dashboard.
Key Monitoring Metrics
| Metric | Frequency | Alert Threshold |
|---|---|---|
| Accuracy | Daily | <90% |
| Error rate | Real-time | >5% |
| Response time | Real-time | >5s avg |
| User satisfaction | Weekly | <3.5/5 |
| Cost per query | Daily | >$X |
Dashboard Components
## Prompt Performance Dashboard

### Real-Time Metrics
- Current error rate: [X]%
- Avg response time: [X.X]s
- Active users: [N]

### Daily Trends
- Accuracy: [Graph showing last 7 days]
- Volume: [Graph showing query count]
- Satisfaction: [Graph showing ratings]

### Alerts
- ⚠️ Accuracy dropped below 90% on [date]
- ✅ All systems normal

### Weekly Summary
- Total queries: [N]
- Average accuracy: [X]%
- Average satisfaction: [X.X]/5
- Top issues: [List]
Balancing Multiple Metrics
The Trade-off Reality
Optimizing one metric often affects others:
MORE DETAILED PROMPTS
    ↓
+ Higher accuracy
+ Better completeness
- Slower response
- Higher cost

SHORTER PROMPTS
    ↓
+ Faster response
+ Lower cost
- May reduce accuracy
- May increase errors
Metric Prioritization Matrix
## Metric Prioritization

| Metric | Priority | Weight | Target | Current |
|:-------|:---------|:-------|:-------|:--------|
| Accuracy | Critical | 30% | ≥95% | 92% |
| Relevance | High | 25% | ≥90% | 94% |
| Actionability | High | 20% | ≥85% | 88% |
| Response Time | Medium | 15% | <3s | 2.1s |
| Cost | Medium | 10% | <$0.01 | $0.008 |

### Composite Score Calculation
Score = Σ(Weight × Normalized_Value)

Current: 0.30×(92/95) + 0.25×(94/90) + 0.20×(88/85)
       + 0.15×(3/2.1) + 0.10×(0.01/0.008)
       = 0.29 + 0.26 + 0.21 + 0.21 + 0.13
       = 1.10 (110% of target)
Decision Framework
When metrics conflict, prioritize based on:

1. SAFETY first
   - Never compromise safety for performance

2. ACCURACY second
   - Wrong fast is worse than right slow

3. RELEVANCE third
   - Must address the actual need

4. USER EXPERIENCE fourth
   - Speed, cost, ease of use

5. EFFICIENCY last
   - Optimize after quality is assured
Evaluation Reporting
Performance Report Template
# Prompt Performance Report

**Period:** [Date range]
**Prompt:** [Name/Version]
**Author:** [Name]

## Executive Summary
[2-3 sentence overview of performance]

## Key Metrics

| Metric | Target | Actual | Status |
|:-------|:-------|:-------|:-------|
| Accuracy | 95% | 94% | ⚠️ Near |
| Completion | 90% | 92% | ✅ Met |
| Satisfaction | 4.0 | 4.2 | ✅ Met |

## Trend Analysis
[Charts/graphs showing trends]

## Issues Identified
1. [Issue 1]: [Impact and frequency]
2. [Issue 2]: [Impact and frequency]

## Recommendations
1. [Recommendation 1]
2. [Recommendation 2]

## Next Steps
- [ ] [Action item 1]
- [ ] [Action item 2]
Key Takeaways
- Quantitative metrics provide objective performance measures
- Qualitative evaluation captures nuances numbers miss
- Benchmarks enable consistent comparison over time
- Continuous monitoring catches degradation early
- Metric trade-offs require thoughtful prioritization
- Regular reporting keeps stakeholders informed
Summary
Performance metrics transform prompt engineering from an art into a science. By defining clear metrics, building benchmarks, monitoring continuously, and balancing trade-offs thoughtfully, you can systematically improve prompt performance over time. The key is measuring what matters, not just what’s easy to measure.
Review Questions
- What are the five core quantitative metrics for prompts?
- How does rubric-based evaluation differ from rating scales?
- What components make up a complete benchmark?
- Why is metric prioritization important?
- What should a performance report include?
Practical Exercise
Exercise 14.1: Metric Definition
For a “Customer Support Bot” prompt, define:
- 5 quantitative metrics with targets
- A rubric for qualitative evaluation
- Priority weighting for each metric
Exercise 14.2: Benchmark Creation
Create a mini-benchmark (10 test cases) for the Customer Support Bot:
- 6 typical cases
- 3 edge cases
- 1 error case
Include inputs, expected outputs, and scoring criteria.