Chapter 12: Adoption Monitoring and Measurement
Learning Objectives
After completing this chapter, you will be able to:
- Define meaningful adoption metrics and KPIs
- Implement measurement systems and data collection approaches
- Analyze adoption data to identify patterns and issues
- Take corrective actions based on measurement insights
- Report on adoption progress to stakeholders
The Importance of Adoption Measurement
Adoption measurement answers the fundamental question: Is the change actually being adopted? Without measurement, organizations rely on assumptions, anecdotes, and wishful thinking about whether change is succeeding. Measurement provides the objective data needed to verify success, identify problems, and drive corrective action.
Many organizations make the mistake of equating project completion with change success. A system can be implemented on time and on budget while completely failing to achieve intended adoption and benefits. Training can be delivered to 100% of users while actual proficiency remains low. Communications can reach everyone while awareness and understanding remain shallow.
Effective adoption measurement distinguishes between activity and outcome. Activity metrics (training delivered, communications sent, meetings held) measure OCM effort. Outcome metrics (actual usage, proficiency levels, behavior change) measure OCM results. Both are valuable, but outcome metrics are the ultimate measure of success.
Measurement Serves Multiple Purposes
Verify Progress: Confirm that adoption is occurring as planned
Identify Issues: Surface problems early when intervention is still possible
Drive Action: Provide data to guide corrective action decisions
Demonstrate Value: Show stakeholders the results of OCM investment
Enable Learning: Build knowledge about what works for future changes
The 6 Key Performance Indicators
The handbook’s framework identifies six KPIs for measuring OCM effectiveness:
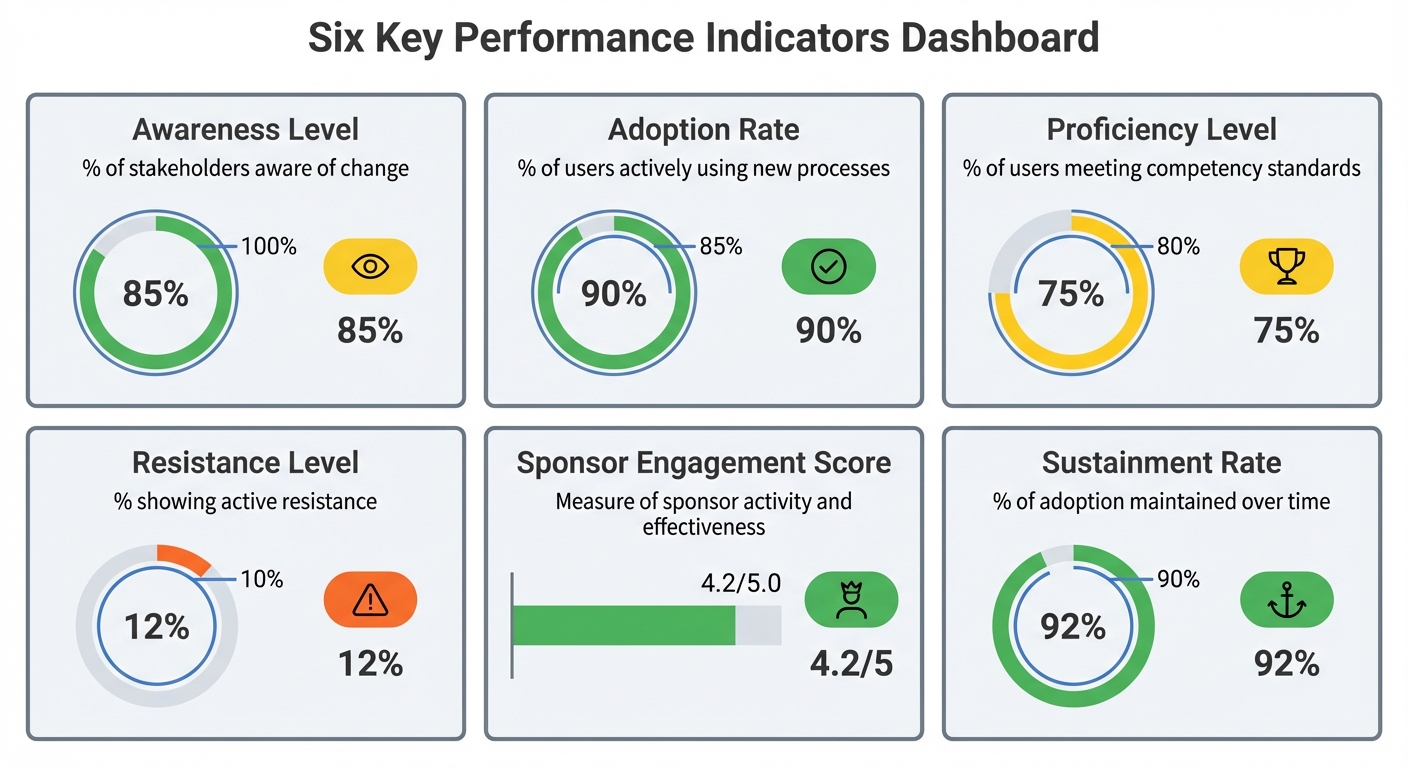
Figure 12.1: OCM Six Key Performance Indicators Dashboard - The six KPIs provide a comprehensive view of adoption progress from initial awareness through sustained adoption. Each metric has specific targets based on research and best practices.
KPI 1: Awareness Level
Definition: Percentage of stakeholders who are aware of the change and understand why it is happening
Target: 100%
Measurement Methods:
- Pulse surveys with awareness questions
- Knowledge checks in communication
- Manager-reported awareness levels
- Random sampling conversations
Sample Survey Questions:
- “I am aware that [change] is happening” (Agree/Disagree)
- “I understand why this change is necessary” (Agree/Disagree)
- “I can explain the main reasons for this change” (Yes/No)
KPI 2: Adoption Rate
Definition: Percentage of users actively using the new processes, systems, or behaviors as intended
Target: ≥85%
Measurement Methods:
- System usage data and analytics
- Process compliance audits
- Observation and spot-checks
- Self-reported usage surveys
Considerations:
- Define what constitutes “adoption” specifically
- Distinguish between initial use and sustained use
- Consider quality of use, not just occurrence
KPI 3: Proficiency Level
Definition: Percentage of users meeting defined competency standards
Target: ≥80%
Measurement Methods:
- Post-training assessments
- On-the-job proficiency checks
- Quality metrics (error rates, rework)
- Manager proficiency ratings
Proficiency Criteria Example:
- Can complete core transactions without assistance
- Error rate below acceptable threshold
- Processing time within target range
- Can handle common exceptions
KPI 4: Resistance Level
Definition: Percentage of stakeholders showing active resistance to change
Target: ≤10%
Measurement Methods:
- Pulse surveys with sentiment questions
- Manager-reported resistance
- Change agent feedback
- Help desk/feedback channel analysis
Resistance Indicators:
- Explicit statements of opposition
- Non-compliance with adoption expectations
- Active undermining or negative influence
- Escalated complaints or grievances
KPI 5: Sponsor Engagement Score
Definition: Measure of sponsor activity and effectiveness
Target: Defined based on sponsor commitments
Measurement Methods:
- Sponsor activity completion tracking
- Stakeholder perception surveys
- Coalition member assessments
- Event attendance and participation
Components:
- Planned activities completed
- Communication effectiveness ratings
- Stakeholder perception of leadership support
- Barrier removal responsiveness
KPI 6: Sustainment Rate
Definition: Percentage of adoption maintained over time (typically 6 months post-implementation)
Target: ≥90%
Measurement Methods:
- Continued usage monitoring
- Periodic proficiency assessments
- Compliance audits over time
- Benefits realization tracking
Why Sustainment Matters:
- Initial adoption often regresses without reinforcement
- True change success is sustained adoption
- Benefits depend on continued adherence
Building a Measurement Framework
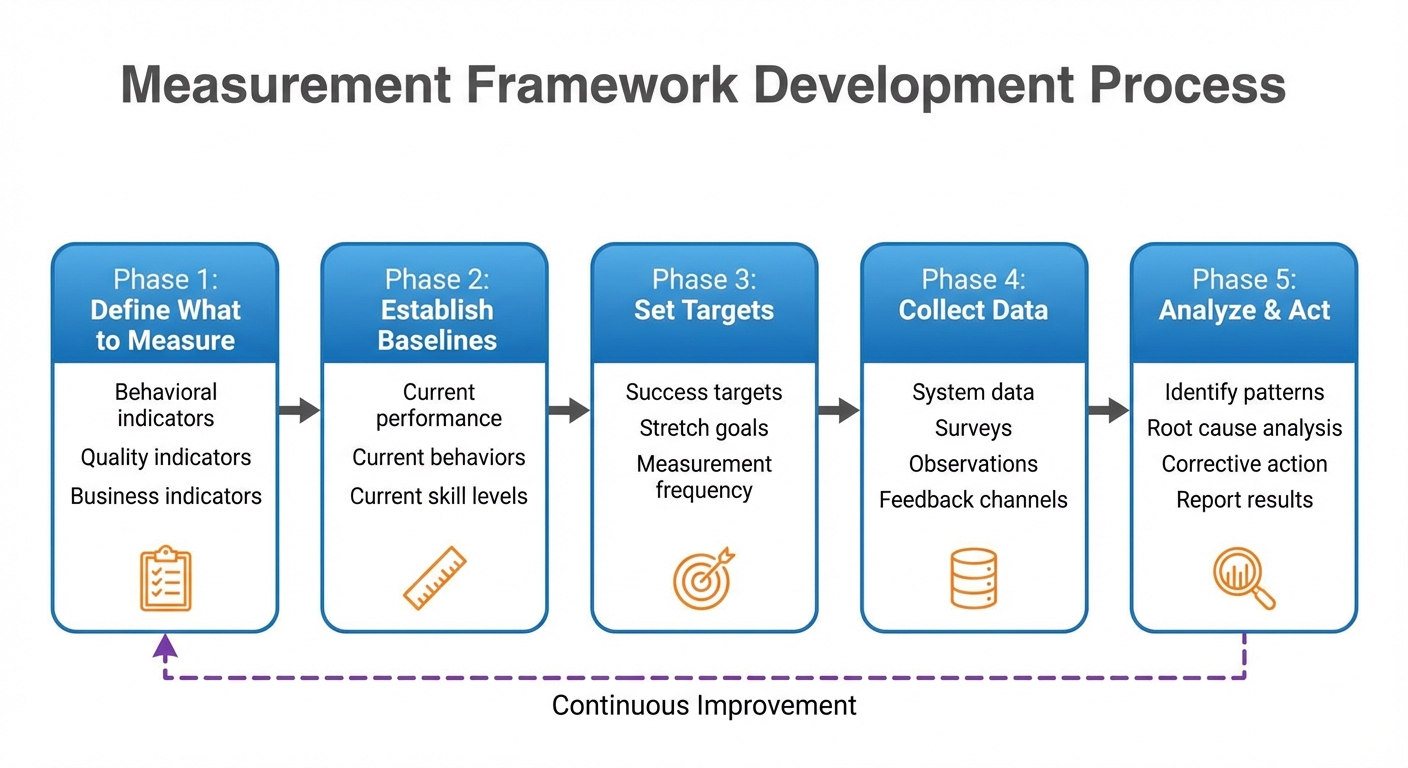
Figure 12.2: Building a Measurement Framework - Effective measurement requires systematic planning from defining metrics through analysis and action. The feedback loop ensures continuous refinement based on learning.
Define What to Measure
Start by clarifying what adoption looks like for your specific change:
Behavioral Indicators: What specific behaviors indicate adoption?
- Using new system instead of old
- Following new process steps
- Applying new skills in daily work
- Demonstrating new ways of interacting
Quality Indicators: What indicates adoption quality?
- Accuracy and error rates
- Processing time and efficiency
- Customer/user satisfaction
- Compliance with standards
Business Indicators: What business outcomes depend on adoption?
- Productivity metrics
- Cost savings
- Quality improvements
- Customer metrics
Establish Baselines
Before change, establish baselines for comparison:
- Current performance metrics
- Current behavior patterns
- Current skill levels
- Current satisfaction levels
Set Targets
Define success targets for each metric:
| Metric | Baseline | Target | Stretch |
|---|---|---|---|
| System usage | 0% | 85% | 95% |
| Error rate | 15% | 5% | 2% |
| Processing time | 10 min | 7 min | 5 min |
| User satisfaction | 3.2/5 | 4.0/5 | 4.5/5 |
Determine Measurement Frequency
Different metrics require different measurement frequencies:
| Metric Type | Frequency | Rationale |
|---|---|---|
| Usage data | Daily/Weekly | Early warning of issues |
| Pulse surveys | Bi-weekly/Monthly | Track sentiment trends |
| Proficiency assessments | At training, +30, +90 days | Verify skill development |
| Business outcomes | Monthly/Quarterly | Confirm benefits realization |
Data Collection Methods
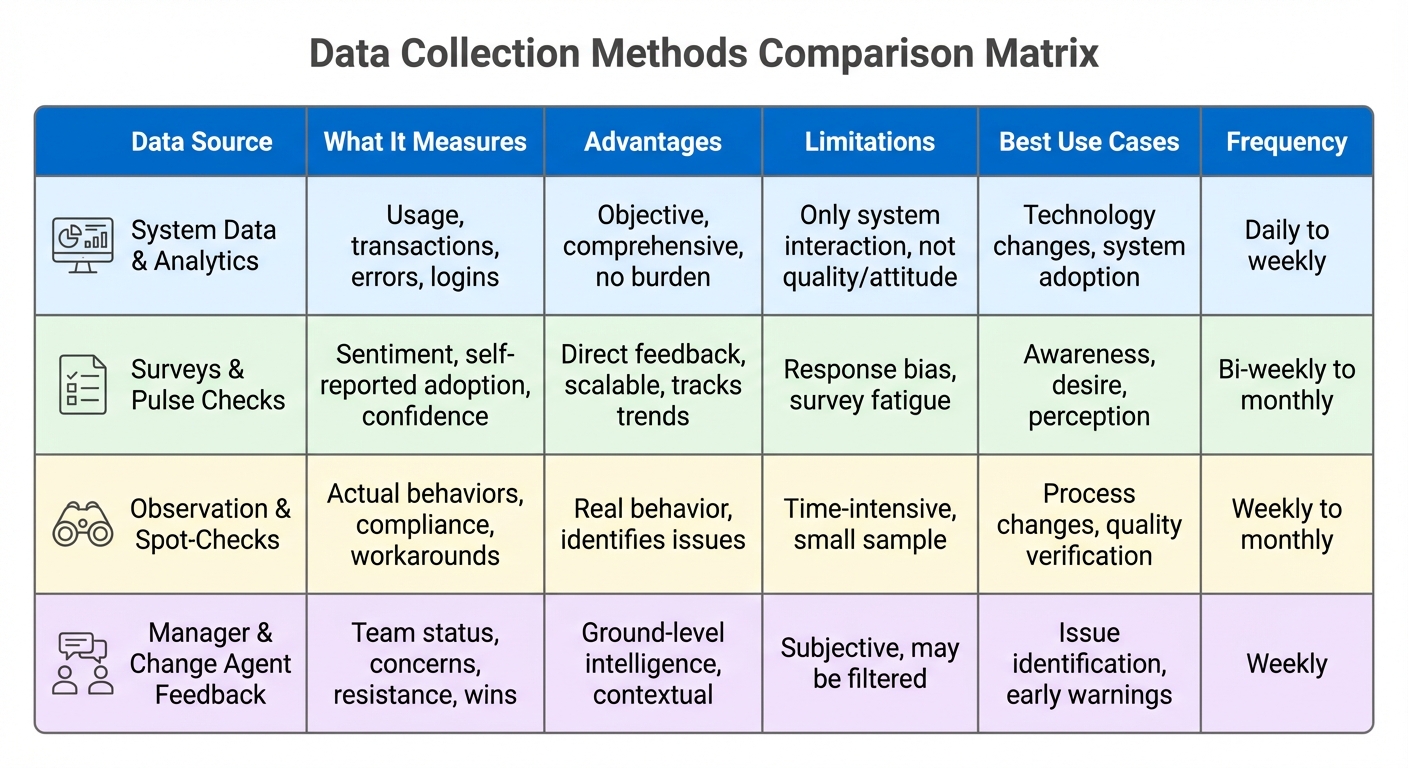
Figure 12.3: Data Collection Methods Comparison - Multiple data sources provide a complete picture of adoption. Each method has strengths and limitations; effective measurement combines multiple approaches.
System Data and Analytics
For technology changes, system data provides objective adoption evidence:
What to Track:
- Login frequency and duration
- Feature/function usage
- Transaction volumes
- Error and exception rates
- Help/support access
Advantages: Objective, comprehensive, no survey burden Limitations: Only captures system interaction, not quality or attitude
Surveys and Pulse Checks
Regular brief surveys capture sentiment and self-reported adoption:
Survey Best Practices:
- Keep surveys short (5-10 questions, 2-3 minutes)
- Use consistent questions for trending
- Include both scaled and open-ended questions
- Ensure anonymity to encourage honesty
- Close the loop by reporting what you learned
Sample Pulse Survey Questions:
- I am using [new system/process] as expected (1-5)
- I am confident in my ability to [key behavior] (1-5)
- I am getting the support I need (1-5)
- What is your biggest challenge with the change? (Open)
- What would help you be more successful? (Open)
Observation and Spot-Checks
Direct observation verifies actual behavior:
Observation Methods:
- Planned observation visits
- Random spot-checks
- Mystery shopper approaches
- Work product review
What to Observe:
- Are people using new processes/systems?
- Are they following expected steps?
- What workarounds are being used?
- Where are people struggling?
Manager and Change Agent Feedback
Managers and change agents provide ground-level intelligence:
Feedback Mechanisms:
- Regular check-in meetings
- Structured reporting templates
- Issue escalation processes
- Informal conversations
What to Gather:
- Team adoption status
- Emerging concerns and questions
- Resistance indicators
- Success stories and wins
Analyzing Adoption Data
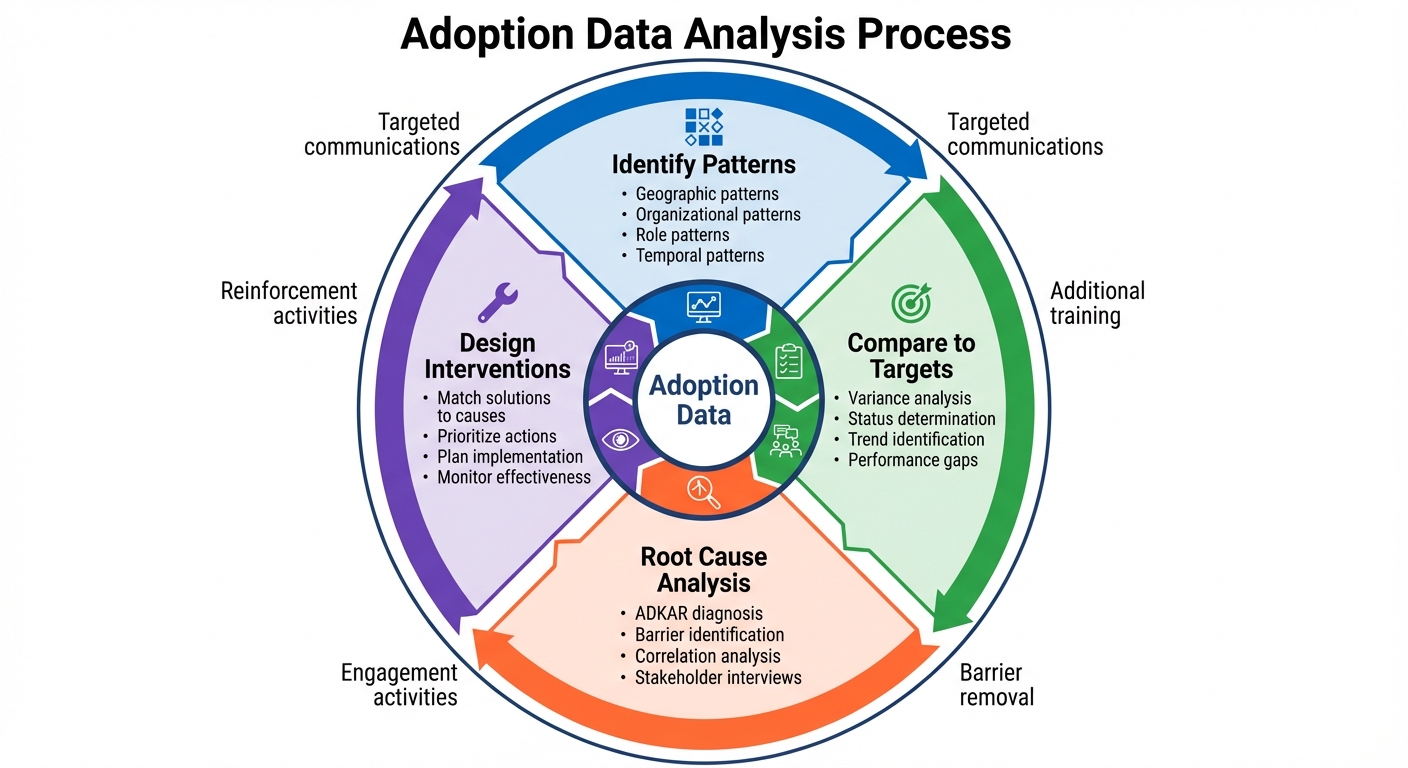
Figure 12.4: Adoption Data Analysis Process - Effective analysis transforms data into action through pattern identification, comparison to targets, root cause analysis, and intervention design.
Identifying Patterns
Look for patterns in adoption data:
Geographic Patterns: Are certain locations adopting faster/slower?
Organizational Patterns: Are certain departments or teams different?
Role Patterns: Are certain roles struggling more than others?
Temporal Patterns: Is adoption trending up, down, or flat?
Root Cause Analysis
When adoption issues are identified, analyze root causes:
Questions to Ask:
- What is preventing adoption?
- Is it an awareness, desire, knowledge, ability, or reinforcement issue?
- What specific barriers exist?
- Who is affected and why?
Analysis Techniques:
- Drill down into data by segment
- Correlate with other factors (training completion, manager support)
- Interview affected individuals
- Observe actual work situations
Comparing to Targets
Regularly compare actual adoption to targets:
| Metric | Target | Actual | Variance | Status |
|---|---|---|---|---|
| Usage rate | 85% | 72% | -13% | At Risk |
| Proficiency | 80% | 78% | -2% | On Track |
| Resistance | <10% | 8% | +2% | On Track |
Taking Corrective Action
When to Intervene
Intervene when:
- Metrics fall significantly below targets
- Negative trends continue across multiple periods
- Specific groups show persistent issues
- Root causes are identified and addressable
Matching Interventions to Issues
| Issue Identified | Potential Interventions |
|---|---|
| Low awareness | Targeted communication, manager cascade |
| Low usage | Adoption campaigns, barrier removal, accountability |
| Low proficiency | Additional training, coaching, job aids |
| High resistance | Engagement, sponsor involvement, concern resolution |
| Regression | Reinforcement activities, compliance monitoring |
Course Correction Process
- Identify issue through monitoring
- Analyze root cause
- Design intervention
- Implement corrective action
- Monitor for improvement
- Adjust if needed
Reporting on Adoption
Dashboard Design
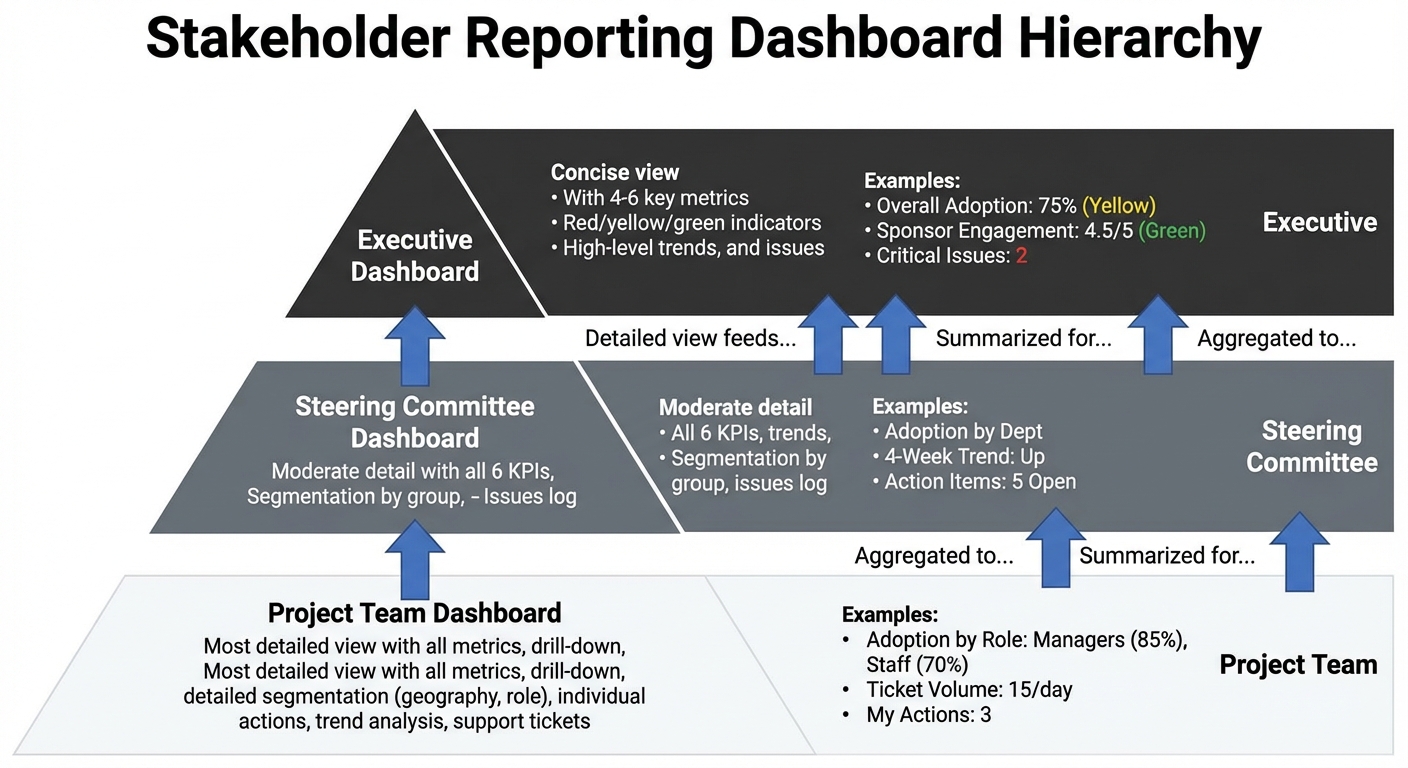
Figure 12.5: Multi-Level Dashboard Hierarchy - Different stakeholders need different views of adoption data. Executive dashboards prioritize high-level status and decisions; project dashboards provide operational detail.
Create dashboards that communicate adoption status clearly:
Dashboard Elements:
- KPI summary with targets and actuals
- Trend lines showing progress over time
- Segmentation by geography, department, role
- Issues and actions log
- Success stories and highlights
Stakeholder Reporting
Different stakeholders need different views:
| Audience | Focus | Frequency |
|---|---|---|
| Steering Committee | Summary KPIs, major issues, decisions needed | Bi-weekly |
| Project Team | Detailed metrics, actions, progress | Weekly |
| Sponsors | High-level status, intervention needs | As needed |
| Change Agents | Ground-level feedback, support needs | Weekly |
Reporting Cadence
Establish regular reporting rhythm:
- Daily: Critical metrics for high-risk periods
- Weekly: Operational status and issues
- Bi-weekly: Steering committee updates
- Monthly: Comprehensive adoption report
- Quarterly: Benefits realization progress
Key Takeaways
- Measurement distinguishes activity from outcomes—focus on whether change is actually being adopted
- Six KPIs provide comprehensive view: awareness, adoption, proficiency, resistance, sponsor engagement, sustainment
- Multiple data sources provide complete picture—system data, surveys, observation, feedback
- Analysis identifies patterns and root causes that guide intervention
- Measurement enables corrective action while there’s still time to improve
- Reporting keeps stakeholders informed and accountable
Summary
Adoption monitoring and measurement provides the objective data needed to verify that change is actually being adopted, identify issues early, and drive corrective action. Without measurement, organizations rely on assumptions and anecdotes that may not reflect reality.
The six KPIs—awareness, adoption rate, proficiency, resistance, sponsor engagement, and sustainment—provide a comprehensive view of adoption progress. Multiple data sources including system analytics, surveys, observation, and feedback create a complete picture. Analysis of adoption data identifies patterns and root causes that enable targeted interventions.
The ultimate purpose of measurement is action. When metrics indicate issues, corrective actions must follow. Measurement without action is wasted effort; measurement that drives improvement is invaluable.